The statistical works by getting simple note informations like date of creation, date of removal, number times the note was edited, and number of times the notes alarmed. No sensible data is collected, and all stats are kept safe inside 7 Sticky Notes.
As it was described in the previous topic Menus & toolbars, the 7 Sticky notes Statistics can be accessed through the Notes Manager, using its upper menus, or the toolbar "Statistics Icon".
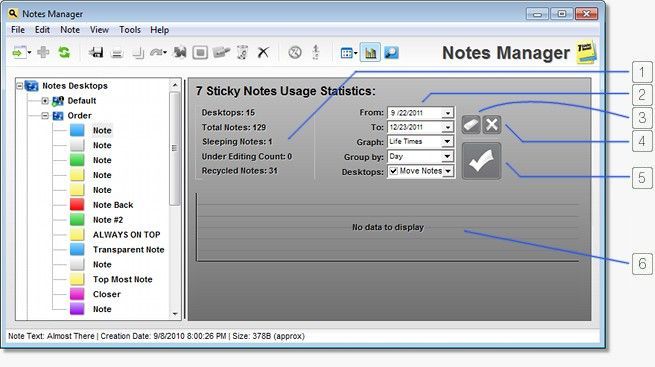
Each part of the Statistics is going to be explained below:
1. General Stats: Here a few general statistical data is showed, such as: total nubmer of Desktops, total number of notes, total number of sleeping notes, total number of notes being edited, and number of notes inside the recycle bin.
2. Statistics Filters: contains several fields that allows you to filter the stats returned after a search. Here you can define the start and end times of the search, the type of the statistical graph, the grouping type and which Desktops you would like to have included at the search.
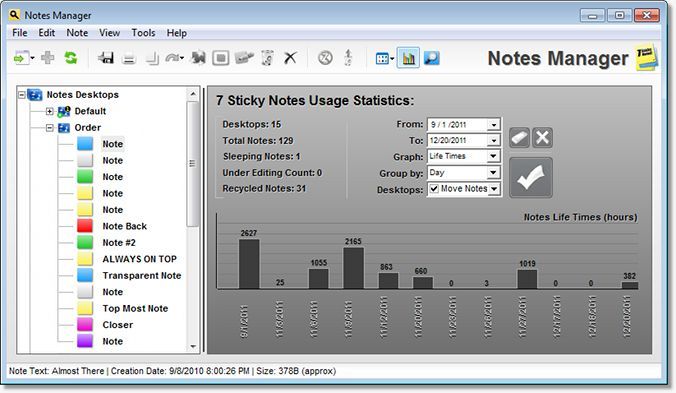
Right now there are available two types of graphs: the "Life Times" and "Total Number". The "Life Times" graph shows you the total time of the notes's life in hours, calculated between the time the note was created and the time it was recycled/removed, and the "Total Nubmer" graph shows the total number of note you had on 7 Sticky Notes along the time.
As for the grouping, there are 3 options available: group by Day, group by Week, and group by Month. When you select each option, 7 Sticky Notes will group the graph results according to your choice. For example, if you group by week, the returned graph for the total notes will show the total number of notes for each week from the start time until the end time.
Finally, the last filter you an apply is the "Desktops" filter. By default all Desktops will be returned after a search, but if you prefer, you can use this drop-down list to unselect any Desktop that you would like to have removed from the search.
3. Clear Graph Button: Clear only the graph, and leaves all statistical data intact.
4. Clear Stats Data Button: Clears completely all existing statistical data. Be careful because this will clear all statistics information you had so far! This action cannot be rolled back, so backup and only clear everything if you are really sure!
5. Get Stats Button: Searches the database and puts all gathered information at the statistics graph.
6. Stats Graph: Here the returned statistics will be displayed in form of a graph with lower x-scale date labels so you can easily see the data. The graph is plotted with auto-scaling feature and it also auto-stretches itself if necessary when the window is resized.
Here is how the notes' "Life Time" graph looks after a search:

This work by 7 Sticky Notes is licensed under a Creative Commons Attribution-NonCommercial-NoDerivs 3.0 Unported License
Permissions beyond the scope of this license may be available at www.7stickynotes.com.